| TtP-S | As of: 12/26/14 13:51 TtP-S Alert Display Format 2 Version 2.1 | |||||||
| Moderator Message (if any): Today’s Buys & Sells.
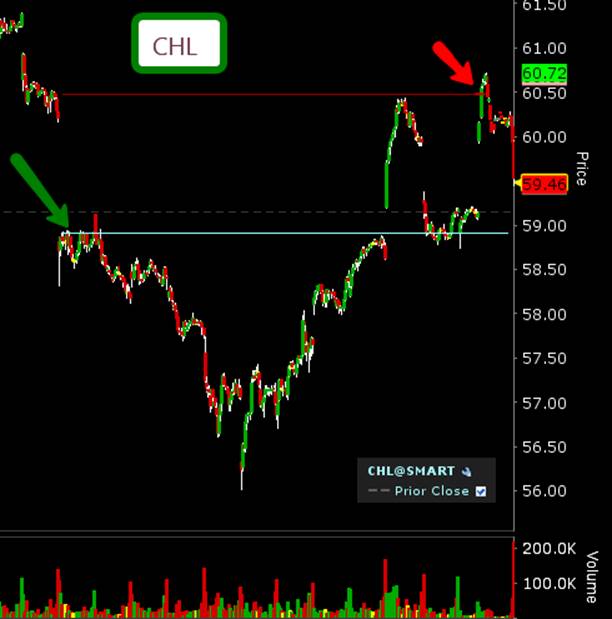
See chart below. Another example of why GTC orders make sense! Pete A |
SPY | DIA | ||||||
| Previous Close | 207.77 | 180.03 | ||||||
| Current Price | 208.44 | 180.19 | ||||||
| Day Low | 208.25 | 180.19 | ||||||
| % Chg from Prev Close | 0.23% | 0.09% | ||||||
| NOT a Buy Day | ||||||||
| (Based on low of the day) | ||||||||
| Today’s Buys/Sells | ||||||||
| Ticker | Buy Price | Buy Date | Profit Target | Sell Price | Sell Date | Profit Percent | Annualized RoI % | Current Position |
| CHL | 58.90 | 2014-12-09 | 60.23 | 60.48 | 2014-12-26 | 2.62% | 56.36% | Sold |
Green arrow is buy point. Red line/arrow is Price Target/Sell Point. As so often happens, the price drops after the PT is reached. Nobody knows if it will arrow up again, but at least our PT was made, and the capital is freed up for new purchases…
